Adroit’s Principal Consultants, Primary Authors of AACE Recommended Practice 129R-23, Linear Scheduling Method (LSM)

The Association for the Advancement of the Cost Engineering (AACE International) has recently released Recommended Practice 129R-23, Linear Scheduling Method (LSM). Dr. Amin Terouhid, PE, PMP and Dr. Mirhadi, PMP, Adroit’s principal consultants, are the two primary authors of this recommended practice. This recommended Practice has been peer reviewed and approved by AACE’s planning and scheduling subcommittee members and has now been released for public review.

The AACE International Recommended Practices (RPs) contain valuable reference information and serve as references for project management, cost engineering, and construction claims professionals around the globe. These documents are regularly and carefully updated, go through multiple peer reviews and revisions before publication, and are routinely reviewed by numerous relevant practitioners. The AACE International Recommended Practices (RPs) have been subject to a rigorous peer review process and are intended to be the main technical foundation of AACE’s educational, and certification products and services.

Adroit’s consultants have previously authored other recommended practices too. They received the AACE 2018 Technical Excellence Award because of their role in authoring some of the recommended practices published by AACE international (including Recommended Practice 91R-16 Schedule Development, Recommended Practice 89R-16 Management Summary Schedule, and Recommended Practice 92R-17 Analyzing Near-Critical Paths).

Project planning and scheduling professionals use a variety of project scheduling methods depending on the type, size, and nature of projects. The linear scheduling method (LSM) is typically used on projects wherein the majority of the scope is made up of highly repetitive work elements along a horizontal or vertical alignment. Examples of these projects include pipeline, tunnel, airport runway, highway, transmission line, road resurfacing, railroad, or high-rise construction projects. An LSM schedule (also known as a linear schedule or march chart) is the graphical output of the LSM. Linear schedules use velocity diagrams, which will be described below, to represent each activity and the progress rate to be achieved (or alternatively, the progress actually achieved) over time. The schedule format typically provides planned and/or actual production rates on a time-scaled, linear format.


This recommended practice (RP) is intended to serve as a guideline, not a standard. As a recommended practice of AACE International, the main objectives of this recommended practice (RP) are to increase LSM usage and enhance project management practices by:

  • Providing an overview of the LSM.
  • Defining characteristics and applications of the LSM.
  • Delineating the steps and main considerations in developing, updating, and managing linear schedules.
  • Highlighting main considerations in interpreting linear schedules

For more information about this recommended practice see:

https://communities.aacei.org/discussion/public-review-draft-129r-23-linear-scheduling-method-lsm-2#bm40b53330-1444-4135-8048-192418b6bd0c

To find out about the strategies for the effective use of project schedules, including the use of Linear Scheduling Method (LSM), please feel free to contact us.

References:

http://web.aacei.org/resources/publications/recommended-practices

Schedule Activity Density Analysis

Dr. Maryam Mirhadi, PMP, PSP | Principal Consultant

One of the tools that can be used to assess the time-phased projected number of activities scheduled over the course of a project is the schedule activity density analysis. A schedule activity density histogram represents the cumulative number of activities that are, partly or wholly, scheduled to be performed within each time unit over the course of the project. The schedule activity density can alternatively be measured by activity-workdays scheduled per time analysis period (if activity durations are defined in days).

For instance, if a 10 and a 20 working-day activities are supposed to start and complete in a particular month, the activity-workdays for that particular month will be 30 (i.e., 10+20). If a 10 working-day activity, a 20 working-day activity, and half of an 8 working-day activity are supposed to start and complete in a particular month, the activity-workdays for that particular month will be 34 (i.e., 10+20+8/2).

As such, if a schedule activity density is high within a particular time analysis period, it can be concluded that a high number of activities are in-progress within that particular time analysis period. Therefore, it is expected that delays influence schedule activity density histograms as well because delays change the number of activities that are scheduled to be undertaken within certain time frames. Delayed work typically results in the overlapping of planned future work; therefore, delays are expected to increase the schedule’s activity density during the time frames in which planned future work will be scheduled.

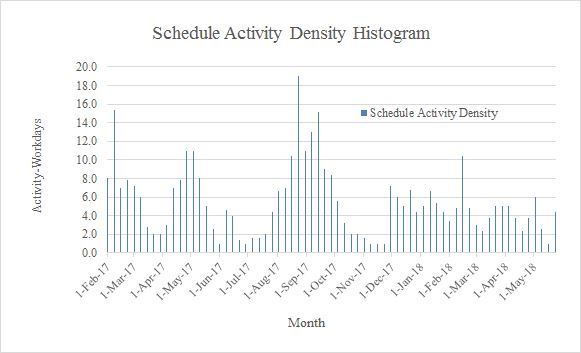
Figure 1 provides an example schedule activity density histogram in which the schedule activity density is shown by the number of activity-workdays scheduled per time analysis period (i.e., monthly periods).

Figure 1. An example schedule activity density histogram

A review of Figure 1 indicates that the schedule activity density is the highest about September 2017 in which the number of activity-workdays is at the highest point whereas, in a time analysis period such as December 2017, the number of activity-workdays is at the lowest point. This indication suggests that in or about September 2017, the highest number of in-progress activities are scheduled whereas in or about December 2017, the lowest number of in-progress activities are scheduled.

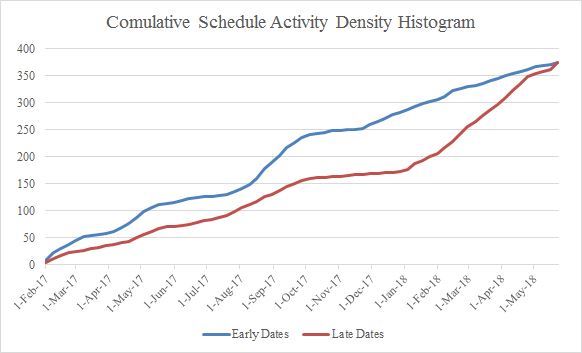
Figure 2 provides an example cumulative schedule activity density histogram in which the cumulative schedule activity density is shown by calculating the cumulative number of activity-workdays scheduled per time analysis period (i.e., monthly periods).

Figure 2. An example cumulative schedule activity density histogram

Two cumulative schedule activity histograms are provided in this figure. The blue histogram represents the schedule activity density for the case where the constraint type of all project activities is set to “As Soon As Possible” whereas the red histogram illustrates the schedule activity density for the case where the constraint type of all project activities is set to “As Late As Possible”. A comparison between these two histograms indicates that the cumulative number of activity-workdays scheduled per time analysis period (i.e., monthly periods) for the late chart is always less than or equal to this cumulative number for the early chart over the course of the project because setting the constraint type of all project activities to “As Late As Possible” prevents the non-critical activities from starting on their early start date and being completed on their early finish dates. This change reduces the cumulative number of activity-workdays scheduled per time analysis period (i.e., monthly periods) for the late chart and the activity density chart shifts to the right of the X-axis suggesting that more activities are being scheduled to be performed later than their original early start and finish dates.

Delayed work typically results in the overlapping of planned future work; therefore, delays are expected to increase the schedule’s activity density during the time frames in which planned future work will be scheduled. Analyzing a schedule activity density histogram is helpful in identifying the likely causes that adversely impact project schedules. For example, delaying events that prevent a set of activities from starting or finishing on-time reduce the schedule’s activity density during the time frames in which planned work cannot be performed in a timely manner but increase the schedule’s activity density during the time frames in which planned future work is supposed to be implemented. Schedule activity density histogram provides an effective way to visualize the density of schedules and obtain a better understanding of the effect of delays on the scheduled workload. 

Our posts to the Insights page share fresh insights and seasoned advice about many project and construction management topics.  To have the Insights monthly newsletter delivered automatically to your email inbox, please subscribe here.

Adroit’s Principal Consultant, A Primary Author of AACE Recommended Practice 89R-16 Management Summary Schedule

The Association for the Advancement of the Cost Engineering (AACE International) has recently released Recommended Practice 89R-16 Management Summary Schedule. Dr. Mirhadi, Adroit’s CEO and one of Adroit’s principal consultants is one of the two primary authors of this recommended practice. The AACE International Recommended Practices (RPs) are intended to be the main technical foundation of AACE’s educational, and certification products and services. The RPs are a series of documents that contain valuable reference information that has been subject to a rigorous review process and recommended for use by AACE’s Technical Board and they become references for project management practitioner throughout the world.

This recommended practice (RP) characterizes management summary schedules, describing their intended use, and identifies considerations for developing and updating these summary schedules. It also addresses roles and responsibilities relating to, and considerations in, communicating management summary schedules to ensure these schedules are used as effective planning, scheduling, and control tools in projects. This RP for management summary schedules is intended to be a guideline, not a standard. Here is the link to an excerpt from this recommended practice. For more information about the strategies for the effective use of project schedules, please feel free to contact us.

References:

https://web.aacei.org/docs/default-source/toc/toc_89r-16.pdf?sfvrsn=8

http://web.aacei.org/resources/publications/recommended-practices

Adroit’s experts are finalizing Recommended Practice RP 89R-16: Management Summary Schedule

Adroit’s competent consultants, as the primary authors of Recommended Practice RP 89R-16: Management Summary Schedule are now working to finalize RP 89R-16. The Association for the Advancement of the Cost Engineering (AACE international), which is one of the well-known international organizations of cost engineering in the world, will release this recommended practice to its members and project management practitioners throughout the world.

On September 19, 2017, AACE international announced that the public review period for RP 89R-16: Management Summary Schedule was closed. Adroit’s competent consultants are now reviewing the comments provided by the project management community to finalize this recommended practice. RP 89R-16: Management Summary Schedule characterizes management summary schedules and defines their intended use. It also identifies the most important considerations for development and updating these summary schedules. RP 89R-16 also addresses roles and responsibilities relating to and considerations in communicating management summary schedules to ensure these schedules are used as effective planning, scheduling, and control tools in managing projects, programs, and portfolios. This RP for management summary schedule is intended to provide a guideline for use by planning and scheduling professionals. Adroit congratulates its expert on this substantial achievements! To find out more about the process of developing project schedules and ways that Adroit’s consultants may be of assistance, please contact us.