Cumulative Impact Claims

Dr.  Amin Terouhid, PE, PMP

This article describes the nature and causes of cumulative impact claims and explores the underlying factors that give rise to cumulative impacts in construction projects.

Changes that are made to a contract scope of work and modifications of work conditions are among the key causes of conflict in construction projects. The net cumulative effect of changes is often greater than the sum of the effect of individual changes.  This condition may occur when a contractor realizes that the work has been affected by unforeseeable synergistic effects of multiple changes. This condition is typically the case where the collective cost, time, and productivity impacts of the changes have been impossible for the contractor to foresee while considering each of the effects individually. The collective impacts of these types of changes are typically identified as the cumulative impact. The Construction Industry Institute (CII) describes cumulative impact as follows:

When there are multiple changes on a project and they act in sequence or concurrently, there is a compounding effect – this is the most damaging consequence for a project and the most difficult to understand and manage. The net effect of the individual changes is much greater than a sum of the individual parts. [1]

A cumulative impact claim typically arises when the changes to a contractor’s scope of work are so numerous and overlapping that the contractor had no reason to know that it was not fully pricing each of the change orders at the time it negotiated the changes one at the time.

Cumulative impacts have unique characteristics that differentiate them from other types of impacts. In the case of cumulative impacts, multiple changes occur whose cumulative effect is greater than the sum of the effect of individual changes. It is important to note, however, that the multiple changes that have a cumulative impact on a scope of work should typically be labor-related changes. Therefore, in assessing cumulative impacts, the dollar value of the changes that have occurred is not as important as their intensity in terms of the number of labor hours required to execute the changed work. The number of labor hours needed to perform the change is critical in evaluating cumulative impacts because the ultimate objective of a cumulative impact claim is to demonstrate the extent of loss of labor productivity arisen from the synergistic effects of multiple changes. It is typically expected that the more labor-intensive the changes are, the greater their individual and cumulative impacts will turn out to be.

To quantify the damages resulted from the cumulative impact of multiple changes, a variety of methods can be used some of which include actual cost method, estimated cost method, total cost method, modified total cost method, should have spent method, measured mile, and jury verdict [2]. What is important, however, is to be able to demonstrate that the damages have resulted from the causes in reference. The success of a cumulative impact claim depends primarily on the ability to establish the cause and effect relationships between the causes in dispute and the resultant cumulative impact. No definitive standard has been established or accepted by courts or dispute boards to quantify the loss of productivity claims that contain a cumulative impact component; therefore, it is typically challenging to prove that damage calculations accurately represent the damages incurred as the sole result of cumulative impacts.

As part of a cause and effect analysis, a written narrative that describes the chain of events is essential. The narrative should properly establish the relationship between causes and resultant impacts. Preparing such a written description of the events, causes, and their effects is a minimum requirement for parties involved in a claim to demonstrate the cause-and-effect relationships between various events and resultant damages. Adequate supporting documents such as excerpts from the contract, change directives, meeting minutes, relevant correspondence, and filed reports can play an important role in substantiating the arguments and supporting the statements contained in the claim.

One of the methods that are often used to assess causal relationships between causes and effects in complex construction claims is the system dynamics method. Complex cases of claim involve multiple claim components that are typically intertwined and interrelated; and as such, assessing these cases may require advanced methods such as system dynamics. This method is an approach within the system thinking domain which considers complex systems as a holistic set of interrelated components to provide a better understanding of the system. Four important questions that are asked in the process of developing a system dynamics model include what is the issue at hand, what is flowing into and gets accumulated in the system representing the problem, where and how does it accumulate, and what factors cause it to flow.

Cumulative impacts should not typically be measured right after a change or during the course of the project while the impact of changes has not fully been materialized. Instead, cumulative impacts are typically measured towards the end of the project to ensure the full adverse, synergistic effect of multiple changes can properly be identified and qualified. Untimely evaluations may partly represent the adverse cumulative impacts that take shape over time.

References:

[1]. T. Hester, John A. Kuprenas. & T. C. Chang (1991). Construction Changes and Change Orders: Their Magnitude and Impact. CII Source Document 66.

[2]. Jones, R. M. (2001). Lost productivity: Claims for the cumulative impact of multiple change orders. Pub. Cont. LJ, 31, 1.


If your project has been affected by multiple change orders and they have adversely affected labor or equipment productivity on-site, or if you are interested to investigate the adverse effects of cumulative impacts on your project, Adroit will be able to assist in assessing these impacts. For more information, please contact us.


Differences between cash and cost flow diagrams

Dr. Maryam Mirhadi, PMP, PSP

Introduction

The terms cost flow and cash flow are often used interchangeably. It is important, however, to identify the purposes that each of these tools intends to serve. These diagrams are among the important elements of financial analysis prior to the commencement of and over the course of a project. Well-prepared cost and cash flow diagrams should be evaluated before making financial decisions concerning a project.

Definitions

A cost flow diagram is a graph that shows expenditures over time. This diagram shows the budgeted amount of money that is needed over time to make progress as planned. Cash flow, however, provides a pictorial representation of income over time. This diagram illustrates how much income the project is going to earn or how much fund will be allocated to the project over the course of a project. A cash flow diagram provides the estimated sums of money to which a project or a project party has access over time. 

In its definition of cash flow, AACE International combines the two aforementioned diagrams. Per the AACE International’s Cost Engineering Terminology (Recommended Practice No. 10S-90), cash flow is a “time-based record of income and expenditures, often presented graphically”, and it shows “inflow and outflow of funds within a project”. A combined view of cash and cost flow illustrates the amount and timing of cash inflows and outflow.

Each of the diagrams discussed above can be prepared from the perspective of different project parties involved in implementing a project. For example, a project cash flow that is prepared from the perspective of an owner may represent how the project is funded from the perspective of an owner but a cash flow prepared from the perspective of a contractor may represent a time-based record of income that the contractor is expected to receive for its particular scope of work.

Benefits

The diagrams discussed above are among the important elements of financial analysis that can be performed prior to the commencement of and over the course of a project. Well-prepared cost and cash flow diagrams should be evaluated before making financial decisions concerning a project.

Prior to the commencement of a project, cost and cash flow diagrams are used to assess the financial justifiability of a project. Once candidate projects are identified, decision makers use cash and cost flow diagrams to decide whether or not a project should be pursued. In project-based organizations that implement a portfolio of projects, these decisions are made to determine if a project can be added to the organization’s portfolio of projects. Capital budgeting methods such as net present value (NPV), payback period, and internal rate of return (IRR) are used to make such decisions.

Over the course of a project, cash and cost flow diagrams can be used to adjust project schedules. If a project team determines that adequate monetary resources are not available to make progress according to the plans, it may decide to postpone some activities to ensure enough funds will be available to be spent when needed. Conversely, if higher-than-expected monetary resources become available during specific periods of time, a project team may decide to ramp up its efforts to benefit from the flexibility that higher-than-expected levels of monetary resources have afforded. For example, if a project-based organization determines that funds will not be available to be allocated to a project, the organization may decide to remove some resources from the project and postpone some activities.

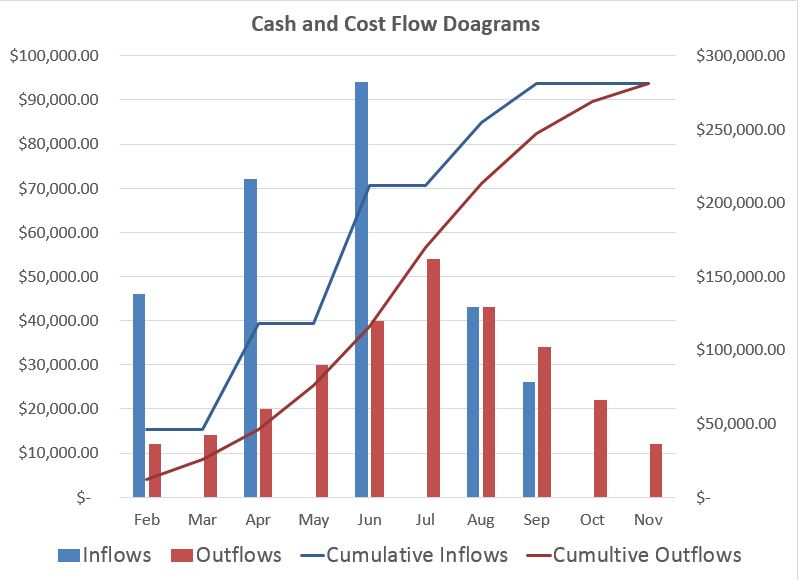
Making a comparison between the cumulative cash and cost flows can also be insightful to identify if adequate monetary resources will be available to fund the project based on its needs. The following figure shows an example of a comparative analysis of cash and cost flow diagram. As this figure indicates, the cumulative cash flow diagram should always represent greater values than the values represented by a cumulative cost flow diagram. A cumulative cash flow diagram that takes values less than the values represented by a cost flow diagram represents insufficiency of funds during certain time periods identifiable by the visual inspection of the diagram.


Assessing the project cost flow can also have other benefits. This analysis can help analyze excessive costs and overruns by comparing the budgeted (i.e., time-phased estimates) cost of performing the changed work with the sums of money originally needed to make progress according to the plans. This assessment can help identify the adverse effect of the change on the resource costs needed over time.

This assessment can be insightful only if the cost flow and estimates are prepared at a sufficiently detailed level. Otherwise, they cannot provide an insight into the impact of change because of the lack of granularity of the pricing data available. Properly documenting the basis of estimates and using proper cost breakdown structures are two other important considerations in budget and cost flow documentation. Detailed budgets or cost flows are prepared by relying on certain assumptions and information available at the time of preparing these estimates. These assumptions and information should properly be documented in a document, entitled “basis of estimate”, for future references.

Conclusion

As noted above, the cost flow diagram and cash flow diagram are among the important elements of financial analysis prior to the commencement of and over the course of a project. The terms cost flow and cash flow are often used interchangeably; however, it is important to identify the purposes that each of these tools intends to serve. A cost flow diagram is a graph that shows expenditures over time. This diagram shows the budgeted amount of money that is needed over time to make progress in accordance with the plans. Cash flow, however, provides a pictorial representation of income over time or the amount and timing of funds that are expected to be allocated to the project.

If you need to prepare cost and cash flow diagram or assess these diagrams to perform financial analysis and make informed decisions, Adroit will be able to assist. For more information, please contact us.
References:

AACE International® (2018). Recommended Practice No. 10S-90 Cost Engineering Terminology. Morgantown, WV: AACE International. Retrieved from http://library.aacei.org/terminology/

A well-drafted contract changes clause

Author: Amin Terouhid, Ph.D, P.E.

Changes that are made to a contract scope of work and modifications of work conditions are among the key causes of conflict in construction projects. A contract changes clause can play an important role in properly allocating risks among the parties to a contract to ensure each party knowingly assumes risks that it is capable of managing.

The main objective of a contract changes clause is to establish a well-drafted procedure for allowing change to the project scope of work and modifications of work conditions that a contractor is subject to. The following table highlights some of the main considerations that need to be given to drafting a contract changes clause.

IDItemsDescription
1The right to make changesA well-drafted contract changes clause needs to recognize proper rights to make changes. These rights are typically, but not always, given only to the owners. If the intent is to specify the individuals who are authorized to direct changes, this requirement must be included and clearly be stated in the contract.
2The size of changes that can be madeThe contract changes clause should clearly identify any limitations on the permissible adjustment to the subcontract price.
3Notice requirementsProper means of communication and issuing change directives need to be defined in the contracts. In addition, the contract should clearly specify the notice requirements that need to be satisfied prior to performing any additional work (e.g., performing additional work following an unwritten change directive) as well as any ramifications of failure in giving proper notices in a timely manner.
4Estimating and pricing considerationsThe contract should identify proper mechanisms for estimating and pricing change orders (e.g., defining pre-approved unit rates and force account procedures), and the roles and responsibilities of the contracting parties in defining the scope of change and providing the information needed for pricing change orders.
5Change order resolution timetableThe contract should provide a procedure to specify the steps that need to be taken for the resolution of cost and time adjustments to the contract due to changes. A change order resolution timetable should also be contained as part of the procedure to define expectations from the time management and construction administration perspectives.
6Conflict resolution proceduresConflicts are inevitable especially in large construction projects. The more changes are made to the contract scope or work conditions, the more likely the conflicts are. As such, a well-drafted contract changes clause needs to define proper conflict resolution procedures to facilitate successful management and resolution of claims and conflicts.
7Unwritten change ordersThe contract should clearly state if unwritten change orders are permissible, and if so, under what circumstances.
8Working under protestIt is important to ensure that a contract changes clause specify if the contractor is contractually required to proceed with a changed work even if the contractor is not in agreement with the directing party about the price of the changed work.
9Time impactsA contract changes clause should define the conditions under which time extensions are issued due to changes. It should also specify if the contactor needs to submit its time extension request in a specified format or within a defined time frame.
10Productivity and cumulative impactsA contract changes clause should specify if productivity or cumulative impacts are permissible to be accounted for in pricing change orders in the event of a change, and if so, how and/or within what time frames the contract allows the contractor to seek compensation for the adverse effects of changes on the contractor’s labor and equipment productivity or request for compensation due to unexpected cumulative impacts whose synergistic effects were unknown at the time of evaluating individual changes.
11Emergency changesIt is expected that a contract changes clause defines if emergency changes are allowable to be made under a serious, unexpected, and often life-threatening or property-damaging emergency requiring immediate action, and if so, what the roles, rights, and obligations of the involved contracting parties are if such a need for change arises.

Since changes to the contract scope or work conditions typically have significant impacts on construction projects, they potentially have time, cost, and productivity implications. Therefore, it is important to take proper steps in minimizing the likelihood and/or impact of conflicts between contracting parties. This article focused on one of these steps and identified some of the key considerations that need to be given to drafting a contract changes clause that exposes the involved parties to smaller risks arisen from changes that take place in construction projects.

If your project has been affected by multiple change orders and they have adversely affected labor or equipment productivity on-site, or if you are interested to investigate the extent of time and cost impacts due to change orders, Adroit will be able to assist in assessing these impacts. To find out more about Adroit’s Construction Claims Consulting services, call 352.327.8029 or contact us using this form.

Activity Duration Types in Primavera P6

In preparing project time schedules in Oracle’s Primavera P6, project planning and scheduling professionals need to properly select duration types. Primavera P6 uses the following two formulae to determine units of work:

Resource Units = Resource Units per Time Unit * Duration

Remaining Resource Units = Resource Units per Time Unit * Remaining Duration

Based on these two formulae, the user is able to make one or two element(s) of the equation fixed, and input or change the other element(s). That way, Primavera P6 will calculate the remaining elements of the equation. To determine which element(s) of the formula to solidify, the users need to take the nature of the work or information at-hand into account and make an informed decision concerning the elements that need to be solidified. This decision then helps the user to choose among the four main types of activity duration types.

Four types of activity duration types can be defined in Primavera P6. They include 1) Fixed Duration & Units, 2) Fixed Duration & Units/Time, 3) Fixed Units, and 4) Fixed Units/Time. The following discusses each of these activity duration types in more depth:

1- Fixed Duration & Units: This types of activity duration is used in Primavera P6 when the duration and the amount of the resources are known and supposed to remain fixed in the schedule. It is recommended that project planning and scheduling professionals use this duration type for time- and budget- constrained projects prior to making schedule updates. The two possibilities include the following:

  • Option 1: Duration does not change when resources are added or removed, or if the user changes Units/Time.
  • Option 2: A change to the Duration will change the Units/Time; however, Units remains unchanged.

2- Fixed Duration & Units/Time: This type of activity duration is used in Primavera P6 when the duration and resource performance are known and are supposed to remain fixed (i.e., unchanged) in the schedule. In other words, activity durations remains unchanged in the schedule; however, the remaining units change. If an activity is supposed to be completed within a certain, fixed time frame irrespective of the number or amount of resources being assigned to the activity, this activity duration type is the right choice that needs to be used for that activity. This activity duration type is most often used if the user uses task dependent activities (not resource dependent activities). The two possibilities include the following:

  • Option 1: Duration does not change when resources are added or removed, or when Units/Time changes.
  • Option 2: A change to the Duration will change the Units; however, Units/Time remains unchanged.

The use of this activity duration type locks the duration, and the default Units/Time (productivity) values for each resource added. Nevertheless, this activity duration types allows the overall Unit cost to increase when resources are assigned to the activity. It is recommended that project planning and scheduling professionals use this duration type during the planning phase because doing so will force Primavera P6 to honor activity duration estimates and increase the work (Units) and, therefore, the budget, based on additional quantities of work performed (Units/Time).

It is important to note that this duration type disables the User Preferences, Calculations tab option Recalculate the Units, Duration, and Units/Time for existing assignments based on the activity types.

3- Fixed Units: Primavera P6 users need to use this type of activity duration if the amount of work needed to complete an activity (e.g., 8,000 bricks to be laid) is fixed. If this type of activity duration is used, decreasing units per time causes the activity duration to increase; however, if the user updates the duration or units per time, the Units remain unchanged. Increasing the resources allocated to an activity whose duration types is Fixed Unit, decreases the activity duration. It is best to use this activity duration type where the duration is “resource dependent” (and not “task dependent”). If in a project, the budget is set and it is difficult to get additional cost increases approved, the Fixed Units activity duration type is the right choice assuming the other above-mentioned requirements are also satisfied.

4- Fixed Units/Time: Primavera P6 users need to use this type of activity duration if the activity has fixed productivity output per time period (regardless of activity duration). In other words, this duration type is supposed to be used when the user would like the resource units per time to remain unchanged while the activity duration or units change. For example, if a piece of equipment requires two workers to operate, the Fixed Units/Time duration type might be the right choice. When the duration of an activity whose duration type is Fixed Units/Time increases, the amount of budgeted labor units also increases while resource Units/Time remains unchanged. This activity duration type is most often used if the user uses resource-dependent activities.

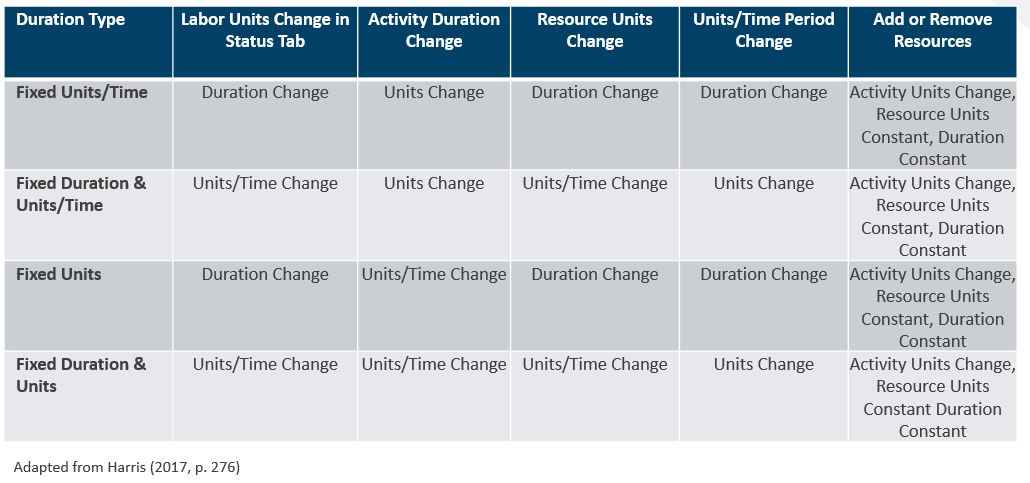
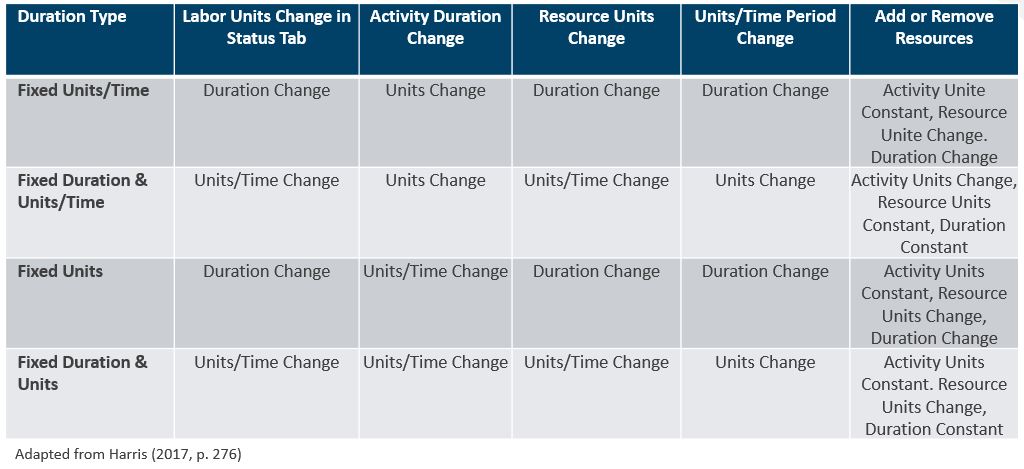
In addition, users have the choice to choose to preserve “the Units, Duration, and Units/Time for existing assignments” or recalculate “the Units, Duration, and Units/Time for existing assignments” in the User Preferences, Calculations tab of Primavera P6. This choice, as well as the choice of activity duration types, determines what element(s) remain(s) unchanged and what element(s) change(s). These scenarios are outlined in the following two tables:

The User Preferences, Calculations tab option “Preserve the Units, Duration, and Units/Time for existing assignments” is chosen when the user adds or removes multiple resource assignments on activities but would like Units, Units/Time, and Durations to remain unchanged when additional resources are assigned to an activity. When the User Preferences, Calculations tab option “Preserve the Units, Duration, and Units/Time for existing assignments” is selected, here are the various scenarios that are encountered:

The User Preferences, Calculations tab option “Recalculate the Units, Duration, and Units/Time for existing assignments” is chosen when the user adds or removes multiple resource assignments on activities and would like to determine a resource assignment’s remaining values based on the activity’s duration type. When the User Preferences, Calculations tab option “Recalculate the Units, Duration, and Units/Time for existing assignments” is selected, here are the various scenarios that are encountered:

As discussed, four types of activity duration types can be defined in Primavera P6. They include 1) Fixed Duration & Units, 2) Fixed Duration & Units/Time, 3) Fixed Units, and 4) Fixed Units/Time. It is important to pay attention to the nature of work that is being performed to select the right type of activity duration types. This article defined each of this activity duration types and explained where each option needs to be used and what the implications of using these duration types are from the scheduling perspective.

References:

Harris, Paul E (2017). Planning and Control Using Oracle Primavera P6 Versions 8 to 17 PPM Professional. Eastwood Harris Pty Ltd.

Oracle (2018). Primavera P6 Professional User Guide Version 17. Available online at: https://docs.oracle.com/cd/E80668_01/English/User_Guides/p6_pro_user/helpmain.htm?toc.htm?62789.htm


A critical comparison between CPM and LSM

In a previous article (Diagrams to illustrate repetitive construction activities), we identified the main diagrams that construction project practitioners use to illustrate repetitive construction activities. In that article, we described the two main classes of linear scheduling methods (LSM) and line of balance (LOB) techniques that are used in linear projects.

Below, we are going to provide a critical comparison between the critical path method (CPM) and linear scheduling method (LSM). As a deterministic network model, the CPM method uses duration estimate for project activities to determine the longest duration path for the project and to identify the earliest and latest dates for schedule activities based on the use of forward- and backward-pass network calculations, respectively. LSM schedules, however, use velocity diagrams representing each activity. The schedule format may provide the planned and actual production rates on a time-scaled format. The main differences between the CPM and LSM methods can be summarized as follows:

 Critical Path Method (CPM)Linear Scheduling Method (LSM)
Application Although this method is typically used in non-linear projects, it can also be used in linear construction projects.It is used in linear construction projects, where the majority of the work is made up of highly repetitive activities. In these projects, a set of project activities are repeated in each location for the entire length of the work. Once a project activity is started and/or ended in one location, it is repeated in another location.
Accuracy With using forward and backward network calculations, the CPM method determines the expected project completion with accuracy. The LSM allows for accurately planning and scheduling of project activities from the perspectives of both time and location.
Uncertainty in activity durationsWith some modifications, the CPM method can change to Program Evaluation and Review Technique (PERT) which allows for randomness by introducing uncertainty to activity duration estimates (i.e., using optimistic, most likely, and pessimistic durations to calculate the expected time for schedule completion).The current forms of LSM do not allow for randomness in activity durations.
Uncertainty in activity relationships With some modifications, the CPM method can change to Graphical Evaluation and Review Technique (GERT) that allows for conditional and probabilistic treatment of logical relationships (i.e., depending on the outcome of the predecessor activities, succeeding activities may or may not be performed).The current forms of LSM do not allow for conditional and probabilistic treatment of logical relationships.
Critical pathThe CPM identifies the critical path based on forward and backward network calculations. The LSM algorithm identifies the controlling activity path (CAP) which can be considered a path with the same function as the critical path in the CPM method. The LSM also identifies location criticality.
Spatial aspectsIt might be inadequate for effective planning and scheduling of linear construction projects because it does not account for work locations or spatial aspects and does not effectively model project activities that are repetitively performed.It uses velocity diagrams representing each activity, accounts for work locations or spatial aspects, and effectively models project activities that are repetitively performed.
Readability and usefulness The CPM method becomes convoluted in complex projects because of the high number of project activities and activity dependencies. This complexity makes it difficult for practitioners to effectively use, communicate, and understand project CPM schedules in complex projects.The LSM method is easy to understand and an effective tool to communicate the project time objectives with all team members including those individuals who lack an in-depth knowledge of project planning and scheduling.
Ease of use and development Computer programs have significantly facilitated the use and development of CPM schedules; however, software programs have become complicated and require extensive training. The LSM is intuitive and can easily be produced with or without the use of computer programs. However, the limited number of computerized implementation platforms restricts the use of this method in large projects.
Ease of updating Computer programs have significantly facilitated the process of updating CPM schedules; however, updating complex CPM schedules may become challenging due to the increased number of activity, activity dependencies, activity constraints, activity calendars, and resource calendars in these schedules. Updating an LSM schedule is typically simple and intuitive.

References:

Mirhadi M. and Terouhid, A. (2018). AACE International Recommended Practice 91R-16 (RP 91R-16): Schedule Development. AACE International (The Association for the Advancement of Cost Engineering). Retrieved from https://web.aacei.org/docs/default-source/toc/toc_91r-16.pdf?sfvrsn=2

Adroit Consultants, LLC (2018). Diagrams to illustrate repetitive construction activities. Retrieved from https://www.adroitprojectconsultants.com/2018/08/06/diagrams-to-illustrate-repetitive-construction-activities/

The project scope has changed, now what?

Project teams need to use effective strategies to minimize changes to the project scope of work; however, change is inevitable and it arises due to a variety of reasons. Examples include the change in an owner’s needs or expectations, design errors and/or omission, differing site conditions not envisioned in the original contract price, changes to the project scope of work due to constructability issues or conflicts between systems, and modifications due to actions or inactions of third-parties. From a contractor’s perspective, the change may arise due to reasons outside the contractor’s control; therefore, it is important for contractors to know what actions they need to take if a change in the project scope of work arises.

In case of a change to the project scope of work, one of the first actions that a contractor needs to take is to provide a proper change notice to the project owner. It is important to note, however, that owners may not be the contracting party or the only contracting party that needs to be notified in case of a scope change. For example, if a scope change modifies a subcontractor’s scope of work, the subcontractor may need to notify the prime contractor first. Typically, contracts contain provisions that define the requirements for timely issuance of change notices.

Most contracts require contractors to issue proper change notices prior to proceeding with the work. They also require contractors to submit proper supporting documentation in a timely manner for reimbursement. Most contracts require that contractors provide a descriptive narrative, an adequately-detailed supplemental information to specify the changed work, and reasons for the change to ensure the changed scope of work is defined with adequate specificity and it is justified and properly documented. They also require that contractors specify the potential impacts of the change on cost, time, and productivity.

The changes to the project scope of work are categorized into the two main classes of directed and constructive changes. The differences between these two types of change are described in Table 1. The need for proper documentation of the change is more evident when a constructive change arises because, in the case of a constructive change, the owner does not specifically direct the contractor to make a change. Instead, the change arises as a result of non-owner-directed events that implicitly necessitate modifying the scope.

Table 1. The differences between directed and constructive changes

AttributeDirected ChangeConstructive Change
The role of ownersIt is issued when the owner specifically directs the contractor to make a change.This change is not a result of owner-directed changes.
Reason for changeThe change occurs because the owner’s needs or expectations have changed.The change occurs as a result of non-owner-directed events that implicitly necessitate modifying the scope.
Owners’ awareness towards the changeThe owner is fully aware of the change because the owner specifically directs the contractor to make a change.The owner does not typically have explicit acknowledgment of the change and/or need for change.
The role of contractors Contracts typically require contractors to make changes as the owner wishes.The contractor is forced to make the change and/or accept its implications.
Ease of recognizing the change It is easier to recognize. It is not easy to recognize.
Degree of complexityIt is typically not complicated because the owner specifically directs the contractor to make a change.It is typically complicated because the owner does not typically have explicit acknowledgment of the change and/or need for the change; and thus, may dispute the change.
Effect on the contractThis change may or may not affect the contract price or timeline.This change typically affects the contract price and/or timeline.
Type of effect on the contractThis change may reduce or add the contract price and/or elongate the expected project duration.This change typically increases the contract price and/or elongates the expected project duration.

Not all contracts allow for proceeding with the work prior to the signing of the change order. Also, some contracts do not contain provisions for constructive changes. Therefore, it is of utmost importance for contractors to know what the contract requirements are for documenting the change and what supporting documentation the owner expect to receive. It is recommended that contractors take the following steps if the owner has directed them to proceed with the work prior to the signing of the change order:

  1. Fully comply with the change notice requirements and give notices in a fashion promulgated by the contract
  2. After reviewing the contract documents and making sure that the scope has changed, submit a change order request, provide proper justification for the change, describe the scope of change, and provide estimates of the potential impacts of the change on time, cost and productivity.
  3. If an adequate information does not exist to prepare accurate estimates of the potential impacts of the change on time, cost and productivity, consider the need for formally reserving the rights to ensure entitlements are not unintentionally waived.
  4. If the contracting parties are not in agreement on the change or its impact, follow the steps outlined in dispute resolution procedures, and give a notice of intent (NOI) to file a claim,  if warranted.
  5. To the extent practically feasible, keep separate tracks of the costs of change using a cost coding that differs from the cost coding used for the base contract to ensure the cost impact of change can be segregated from the cost of performing the original scope of work.

Taking the aforementioned steps are important to facilitate the resolution of any modification to the project scope of work with the owner and to minimize disputes to the extent possible.

A sustainable construction practice to avoid the risk of Legionnaires’ disease

Facility managers and many other stakeholders are increasingly interested to find out more about effective water management strategies in buildings and facilities to prevent Legionella Infection. Legionnaires’ disease is a severe respiratory disease caused by the bacterium Legionella pneumophila. The bacteria may also cause a less serious illness that is referred to as Pontiac fever. Legionnaires’ disease is similar to other types of pneumonia, with common symptoms such as cough, fever, shortness of breath, muscle aches, and headaches, or less common symptoms such as nausea, diarrhea, and confusion. This bacteria is found in both potable and non-potable water systems (DOH, 2018a). The key question is how the risks associated with this infection can be managed.

Although the need for more effective water management strategies became more apparent in 2015 when the American Society of Heating, Refrigeration, and Air Conditioning Engineers (ASHRAE) released Legionella standard, ANSI/ASHRAE 188-2015, cases of Legionella infection are still being reported. For example, in a recent case, the New York State Department of Health announced that individuals who were guests at the Watkins Glen Harbor Hotel between July 16, 2018 and August 1, 2018 or those who were in proximity to the hotel’s pool and spa may have been exposed to Legionella bacteria (DOH, 2018b).  

ANSI/ASHRAE 188-2015 is one of the main standards that define the main considerations in building water systems to manage the risks associated with Legionella infection. To implement effective water management strategies, potential risks associated with the water management systems need to be identified, assessed, and managed properly. Although risks are typically classified into positive and negative risks, this article focuses on negative risks or threats. Negative risks are any potential events or conditions that may adversely impact asset management objectives. A proper application of risk assessment techniques makes facilities less vulnerable to potential risks arisen from Legionella bacteria.  Addressing issues after the fact usually costs significantly higher compared to the amounts paid for implementing risk response strategies. Therefore, using risk management practices are important not only to protect facilities and water management systems from detrimental risks but also to ensure that facility owners, such as commercial buildings, do not incur costs due to unmanaged risks.

Risk management consists of the key processes of planning for risk management, identification, assessment, response planning (i.e., risk treatment), and risk control. To make facilities less vulnerable to potential risks arisen from Legionella bacteria, risk response strategies need to be identified for all potential risks that may arise. Risk response strategies are the actions that can be taken in case of a risk occurrence. In general, four classes of risk response strategies exist. As shown in Table 1, these classes include risk avoidance, risk transfer, risk mitigation, and risk acceptance:

Table 1. Risk-response strategies for managing negative risks

Risk response strategyDescription
AvoidEliminate the risk
TransferTransfer the risk to a third party
MitigateReduce the probability or impact of the risk
AcceptAccept the risk by taking no actions or, at most, setting aside contingency to offset the adverse effect of the risk

Risk acceptance and risk transfer are not typically among the risk response strategies that facility managers can choose to treat the risks associated with Legionnaires’ disease; otherwise, facility managers will not be able to satisfy the requirements of various standards, codes, and regulations. As such, the only two viable risk response strategies that facility managers can rely on in managing the risks associated with Legionnaires’ disease are risk mitigation and risk avoidance. To implement risk mitigation strategies, they need to reduce the probability or impact of the risk by adopting proper building water management practices. These include strategies such as keeping water at an appropriate temperature and free of impurities and verifying the effectiveness of building water management plans.

To implement risk avoidance strategies, facility managers need to eliminate the risk. Some of the building water management strategies that, to a large extent, eliminate the risk of Legionnaires’ disease, can be classified under the risk avoidance (i.e., risk elimination) category. Although these risks cannot entirely be eliminated, these strategies can play important roles in minimizing the likelihood of the risk occurrence. One of the strategies that can be classified as a risk avoidance strategy is the use of geothermal heat pumps (GHPs) in buildings. GHPs are also known as GeoExchange, earth-coupled, ground-source, or water-source heat pumps. Instead of using the outside air temperature as the exchange medium, GHPs use the constant temperature of the earth as the exchange medium. During the winter, the ground is warmer than the air above it whereas, during the summer, the ground is cooler than the air. GHPs take advantage of this characteristic of the earth by exchanging heat with the earth through a ground heat exchanger (DOE, 2018). If geothermal exchangers are incorporated during the building design process and used in place of cooling towers in buildings, they can eliminate the need for a recirculated water system that uses evaporative cooling for rejecting the heat to the air. Other benefits of GHPs include high energy efficiency, durability, and high energy efficiency (EPA, 2018). Because cooling towers, evaporative condensers, and fluid containers have been identified as one of the main sources of dispersing water-dispersed diseases such as Legionellosis disease, eliminating the need for a recirculated water system can be an effective sustainable construction strategy to avoid the risk of Legionellosis disease.

To implement effective water management strategies, potential risks associated with the water management systems need to be identified, assessed, and managed. A proper application of risk management techniques makes facilities less vulnerable to potential risks arisen from Legionella bacteria. This article identified some of the risk response strategies that can be used to ensure systems are in place to prevent and control Legionnaires’ disease. This article identified risk mitigation and risk avoidance as the two main risk response strategies for managing the risks associated with Legionella infection, and discussed the use of geothermal heat pumps (GHPs) as a way to eliminate these risks.

For more information about building water, risk assessment, and Legionella services that Adroit provides, please visit the following page or contact us:

Building Water and Legionella Services

References:

Department of Energy [DOE] (2018). Geothermal Heat Pumps. Retrieved from https://www.energy.gov/energysaver/heat-and-cool/heat-pump-systems/geothermal-heat-pumps

Department of Health [DOH] (2018a). Legionnaires’ Disease. Retrieved from https://www.cdc.gov/legionella/

Department of Health [DOH] (2018b). New York State Department of Health Warns of Potential Exposure to Legionella Bacteria in Schuyler County. Retrieved from https://www.health.ny.gov/press/releases/2018/2018-08-09_legionellosis.htm

The United States Environmental Protection Agency [EPA] (2018). Geothermal Heating and Cooling Technologies. Retrieved from https://www.epa.gov/rhc/geothermal-heating-and-cooling-technologies

Effective Water Management Strategies to Prevent Legionella Bacteria

Government agencies, water management professionals, healthcare facility managers, and many other stakeholders are increasingly interested to find out more about effective water management strategies to prevent Legionella Infection. Legionnaires’ disease is a severe respiratory disease caused by the bacterium Legionella pneumophila. This bacteria is found in both potable and non-potable water systems. The need for more effective water management strategies became more apparent in 2015 when the American Society of Heating, Refrigeration, and Air Conditioning Engineers (ASHRAE) released Legionella standard, ANSI/ASHRAE 188-2015 after a consensus was reached among government agencies and industry groups concerning the general approach to preventing and controlling Legionnaires’ disease.

ANSI/ASHRAE 188-2015 identified some of the important considerations in managing water management systems to ensure proper strategies are in place to prevent and control Legionnaires’ disease. In 2015, an outbreak of Legionnaires’ disease was identified as the cause of death for 12 individuals in the South Bronx in the City of New York. This outbreak also sickened about 120 people in the same area. Several cooling towers in the affected areas tested positive for legionella. In response to this outbreak, building owners and facility managers in New York are now required to register cooling towers, evaporative condensers, and fluid containers with the Department of Buildings. After this outbreak, the Centers for Disease Control and Prevention (CDC) also reported about the increased number of Legionnaires’ disease cases and highlighted the importance of more effective building water management.  

To implement effective water management strategies, potential risks associated with the water management systems need to be identified, assessed, and managed properly. Although risks are typically classified into positive and negative risks, this article focuses on negative risks or threats. Negative risks are any potential events or conditions that may adversely impact asset management objectives. A proper application of risk assessment techniques makes facilities less vulnerable to potential risks arisen from Legionella bacteria.  Addressing issues after the fact usually costs significantly higher compared to the amounts paid for implementing risk response strategies. Therefore, using risk management practices are important not only to protect facilities and water management systems from detrimental risks but also to ensure that facility owners, such as commercial buildings and hospitals, do not incur costs due to unmanaged risks. Risk management consists of the key processes of planning for risk management, identification, assessment, response planning (i.e., risk treatment), and risk control. The following are some of the recommended practices to ensure risk management practices are properly used for water systems in buildings and facilities:

a)      Establish water management program (WMP)

Many benefits can be gained by timely establishing a water management plan (also known as water management program [WMP]) even if an audit is not forthcoming. ANSI/ASHRAE 188-2015 can be used as a guideline and a reference but other recommended practices need to be considered to determine the best strategies that can be used to protect the occupants and users of buildings and facilities against Legionnaires’ disease because cooling towers, evaporative condensers, and fluid containers have been identified as one of the main sources of dispersing water-dispersed diseases (e.g. Legionellosis).

b)     Follow your WMP and improve as needed

Property owners and facility managers protect themselves against legal and non-legal risks and expenses if they, not only prepare but also implement water management programs to demonstrate they have exercised standards of care in preventing diseases associated with water systems. Any WMP needs to be reviewed on a regular basis to identify the areas for improvements and adjust the strategies as needed.

c)       Compliance with rules and regulations

In New York, compliance with portions of ANSI/ASHRAE 188-2015 is mandatory. Other states have also started to adopt more measures in this regard to protect public safety. Therefore, it is good practice for property owners and facility managers to use proactive water management measures to ensure that their facilities meet and exceed the minimum requirements established by consensus-based standards and guidelines. Examples include ANSI/ASHRAE standard 188-2015, Legionellosis: Risk Management for Building Water Systems, and NSF Standard 453-2016.

d)      Use of proper liability insurance coverage

Another protective measure that property owners can adopt is to ensure that their liability insurance provides adequate coverage against the Legionella claims.

e)      Use internal audits for quality assurance

Quality assurance and quality control are two aspects of quality management, and both are important to ensure proper tools, techniques, and practices are used to effectively manage water systems in buildings and facilities. Quality assurance has an important role, similar to the role of the quality control; however, it may be considered a more fundamental need because it focuses on providing confidence that requirements will be satisfied. In other words, quality assurance ensures that proper water management systems, practices, and procedures are in place and followed.

To implement effective water management strategies, potential risks associated with the water management systems need to be identified, assessed, and managed. A proper application of risk management techniques makes facilities less vulnerable to potential risks arisen from Legionella bacteria. This article identified some of the recommended practices to ensure risk management practices are properly used for water systems to prevent and control Legionnaires’ disease, especially because cooling towers, evaporative condensers, and fluid containers have been identified as one of the main sources of dispersing water-dispersed diseases (e.g. Legionellosis). These practices include establishing water management program (WMP), following WMPs and improving them as needed, compliance with rules and regulations, using proper liability insurance coverage, and using internal audits for quality assurance. Using risk management practices are important not only to protect facilities and water management systems from detrimental risks but also to ensure that facility owners, such as commercial buildings and hospitals, do not incur costs due to unmanaged risks associated with Legionnaires’ disease.

For more information about building water, risk assessment, and Legionella services that Adroit provides, please check out the following page or contact us:

Building Water and Legionella Services

Diagrams to illustrate repetitive construction activities

Dr. Maryam Mirhadi, PMP, PSP

Project planning and scheduling professional may use different project scheduling methods and techniques for different projects depending on the type, size, and nature of projects. Repetitive scheduling techniques are used is in linear construction projects. In linear construction projects, the majority of the work is made up of highly repetitive activities. In these projects, a set of project activities are repeated in each location for the entire length of the work. Once a project activity is started and/or ended in one location, it is repeated in another location. Examples of linear construction projects include pipeline projects, highway construction, highway resurfacing and maintenance, airport runway construction and resurfacing tunnels, mass transit systems, and railroads. Because of the highly repetitive nature of the work, high-rise building projects are also often identified as linear in nature.

One of the important considerations in the planning of linear construction projects is to identify a location for the working crew to move to in a manner that its work does not interfere with the work of any other construction crew. Therefore, production rates have to be coordinated to prevent a preceding process from overtaking its succeeding process(s).   

Traditional project planning and scheduling methods such as the critical path methods are typically inadequate for effective planning and scheduling of linear construction projects because these planning and scheduling methods do not account for work locations or spatial aspects and do not effectively model project activities that are repetitively performed. Due to such shortcomings, other methods such as line of balance (LOB), vertical production method (VPM), time couplings method (TCM), the repetitive project modelling (RPM), repetitive construction (REPCON), and the repetitive scheduling method (RSM) have been proposed in the literature to better satisfy the planning and scheduling needs of linear construction projects. The various repetitive scheduling techniques can be categorized into the two main classes of linear scheduling methods (LSM) and line of balance (LOB) techniques.

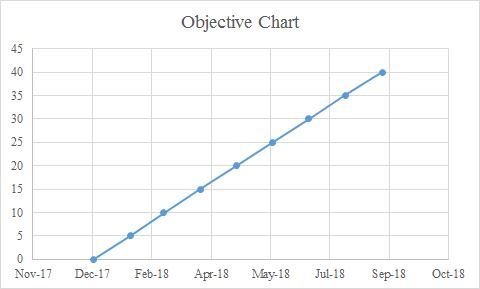
Line of balance techniques use three key types of charts to illustrate repetitive construction activities. These charts are objective chart, production plan, and progress chart. LOB was first used in the manufacturing industry. It starts with the end product and the ultimate output quantity and schedule in mind. This information is documented in the production plan and it is then used to establish a cumulative plan that delineates how much work ought to be delivered over time. This cumulative plan then becomes the objective chart against which the actual progress is measured using the progress chart. An example objective chart that is used in the line of balance method is shown in the figure below.

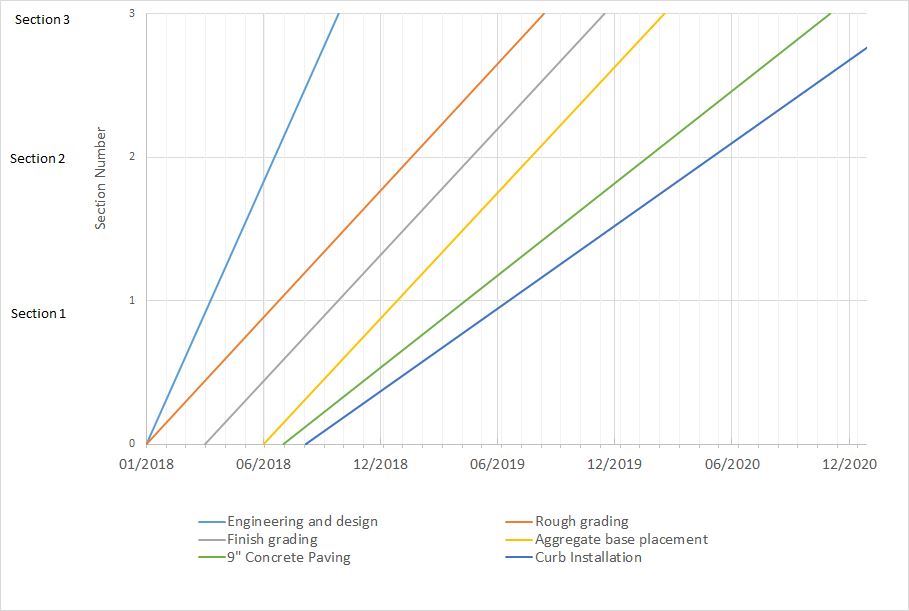
LSM schedules, however, use velocity diagrams representing each activity. The schedule format may provide the planned and actual production rates on a time-scaled format. A typical LSM diagram represents time along the X-axis (i.e., horizontal axis) and some measure of repetitive units along the Y-axis (i.e., vertical axis). This diagram also includes lines that represent all the linear activities that are involved in the completion of the repetitive units. A linear activity is a project activity that progresses along a physical path. This path is represented by the location axis in the LSM. Over the course of the project and at any point of progress along this path, the activity is completed up to that point. For instance, consider an activity that involves rough grading before finish grading in a road construction project. In this example, as the path is rough-graded, the rough-grading activity is complete up to that point of progress along the path. Once the path is rough-graded at any location, no need exists anymore to go back and rough-grade the location. Therefore, any location along the path that is behind the current work location is a work-front for succeeding activities (e.g., finish grading) to be performed. An example LSM diagram is shown in the figure below.

In a future article, further considerations in developing the linear scheduling and line of balance techniques will further be described.

Our posts to the Insights page share fresh insights and seasoned advice about many project and construction management topics.  To have the Insights monthly newsletter delivered automatically to your email inbox, please subscribe here.

Schedule Activity Density Analysis

Dr. Maryam Mirhadi, PMP, PSP | Principal Consultant

One of the tools that can be used to assess the time-phased projected number of activities scheduled over the course of a project is the schedule activity density analysis. A schedule activity density histogram represents the cumulative number of activities that are, partly or wholly, scheduled to be performed within each time unit over the course of the project. The schedule activity density can alternatively be measured by activity-workdays scheduled per time analysis period (if activity durations are defined in days).

For instance, if a 10 and a 20 working-day activities are supposed to start and complete in a particular month, the activity-workdays for that particular month will be 30 (i.e., 10+20). If a 10 working-day activity, a 20 working-day activity, and half of an 8 working-day activity are supposed to start and complete in a particular month, the activity-workdays for that particular month will be 34 (i.e., 10+20+8/2).

As such, if a schedule activity density is high within a particular time analysis period, it can be concluded that a high number of activities are in-progress within that particular time analysis period. Therefore, it is expected that delays influence schedule activity density histograms as well because delays change the number of activities that are scheduled to be undertaken within certain time frames. Delayed work typically results in the overlapping of planned future work; therefore, delays are expected to increase the schedule’s activity density during the time frames in which planned future work will be scheduled.

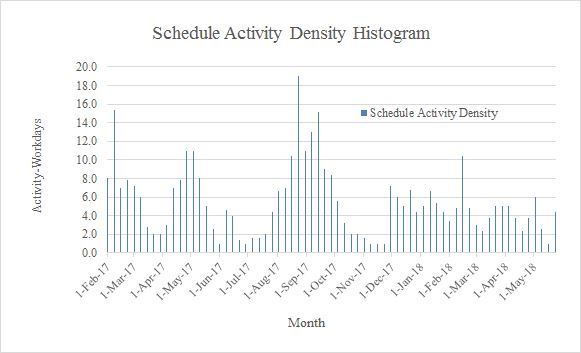
Figure 1 provides an example schedule activity density histogram in which the schedule activity density is shown by the number of activity-workdays scheduled per time analysis period (i.e., monthly periods).

Figure 1. An example schedule activity density histogram

A review of Figure 1 indicates that the schedule activity density is the highest about September 2017 in which the number of activity-workdays is at the highest point whereas, in a time analysis period such as December 2017, the number of activity-workdays is at the lowest point. This indication suggests that in or about September 2017, the highest number of in-progress activities are scheduled whereas in or about December 2017, the lowest number of in-progress activities are scheduled.

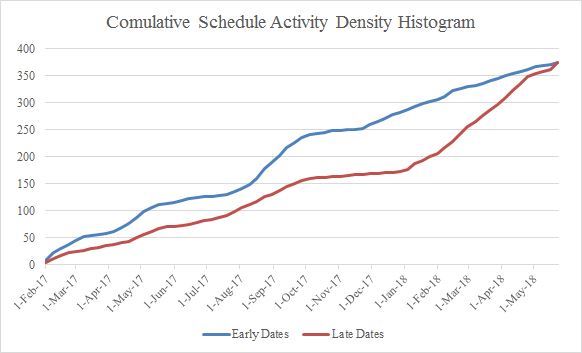
Figure 2 provides an example cumulative schedule activity density histogram in which the cumulative schedule activity density is shown by calculating the cumulative number of activity-workdays scheduled per time analysis period (i.e., monthly periods).

Figure 2. An example cumulative schedule activity density histogram

Two cumulative schedule activity histograms are provided in this figure. The blue histogram represents the schedule activity density for the case where the constraint type of all project activities is set to “As Soon As Possible” whereas the red histogram illustrates the schedule activity density for the case where the constraint type of all project activities is set to “As Late As Possible”. A comparison between these two histograms indicates that the cumulative number of activity-workdays scheduled per time analysis period (i.e., monthly periods) for the late chart is always less than or equal to this cumulative number for the early chart over the course of the project because setting the constraint type of all project activities to “As Late As Possible” prevents the non-critical activities from starting on their early start date and being completed on their early finish dates. This change reduces the cumulative number of activity-workdays scheduled per time analysis period (i.e., monthly periods) for the late chart and the activity density chart shifts to the right of the X-axis suggesting that more activities are being scheduled to be performed later than their original early start and finish dates.

Delayed work typically results in the overlapping of planned future work; therefore, delays are expected to increase the schedule’s activity density during the time frames in which planned future work will be scheduled. Analyzing a schedule activity density histogram is helpful in identifying the likely causes that adversely impact project schedules. For example, delaying events that prevent a set of activities from starting or finishing on-time reduce the schedule’s activity density during the time frames in which planned work cannot be performed in a timely manner but increase the schedule’s activity density during the time frames in which planned future work is supposed to be implemented. Schedule activity density histogram provides an effective way to visualize the density of schedules and obtain a better understanding of the effect of delays on the scheduled workload. 

Our posts to the Insights page share fresh insights and seasoned advice about many project and construction management topics.  To have the Insights monthly newsletter delivered automatically to your email inbox, please subscribe here.